Financial Ratio Analysis
Now that you've got a strong collection of financial information about your business, it's time to go beyond the more obvious financial indicators of profit and equity, to develop an organized list of financial “vital signs” for your business.
In reality, there are many ways to monitor your financial progress. All of them have something of value to offer, but clearly some are more useful than others. Since time is a finite commodity, and since you have other things to do, you'll likely have a limited amount of it for reviewing your finances. So, based on the nature of your particular business, you'll want to identify the indicators that best represent the current financial state of your business, while helping you make the best financial decisions.
You have already begun to track your Financial KPIs. This is an extension of this process, but with a more analytical focus on the numbers. These are commonly referred to as Financial Ratios. While they involve some simple calculations, they offer a tremendous platform for financial analysis.
Financial Ratios are a method of relating two or more different financial numbers from your records to each other. They offer you insights into your financial status that can otherwise be difficult to see. They let you analyze your finances in relation to previous years, to other businesses, and to the industry in general by levelling the playing field. In other words, they let you “compare apples to apples and oranges to oranges.”
As you review your financial ratios, trends or patterns will begin to reveal themselves. By monitoring these patterns over time, you will be better able to predict and impact your financial future.
Ratio analysis is mostly used to figure out which questions need to be asked, not what the answers to those questions are. It provides “warning flags” for management so they can identify problems or successes and then examine the business unit or department in more detail to figure out the causes.
Like other forms of financial analysis, ratio analysis has its limitations, including:
- Ratios are not useful when analyzed in isolation; they must be analyzed in terms of your business’ past performance or against industry averages. Therefore, they are used for analyzing trends, not specific measurements. This is especially the case for ratios that involve both income statement items and balance sheet items.
For example: When observing a Year-To-Date “Inventory Turnover” graph, the trend will almost always be positive and upward sloping. The rate of change (the steepness of the curve) is what's important, not the actual ratio.
Conclusions can rarely be made by analyzing one set of ratios; all ratios must be viewed relative to each other.
A “good” or “bad” value for a ratio is highly dependent on the industry the business operates in.
For example: When analyzing “Asset Turnover” a capital-intensive industry, such as manufacturing, will have a much lower turnover than a current asset-based industry, such as retail.
- If your business operates in multiple industries, it may be difficult to locate an appropriate “industry average” for comparison. Determining a target value may be difficult; it may involve identifying a range of acceptable values.
As financial ratios analyze performance, we'll refer to them as KPIs because they can be set as targets and analyzed to see how a specific part of the business is performing. KPIs can be categorized based on the type of information they provide about a business, including Operating Liquidity, Solvency, Profitability and Cash Flow KPIs.
Following are several common Financial Ratios to consider for your list of KPIs. They are a good place to start, but they are not your only options. There may be specific indicators that are more suited to the specific needs of your business as well. Your accountant can help you to identify the Financial KPIs that will be most useful to you at this time. If you can't think of anything right now, simply choose from the list below. You can always update your list down the road.
Contribution Margin Ratio
This is the amount left over from your Net Sales after your Variable Expenses have been paid (see income statement). It's the amount of money available to cover Fixed Costs and generate a Profit. It is expressed as a percentage on your Common Size Income Statement. It is also a primary building block for the Break-Even formula.
Contribution ÷ Net Sales X 100
“To measure is to know.”
Break-Even Revenues
Fixed Expenses ÷ Contribution Margin
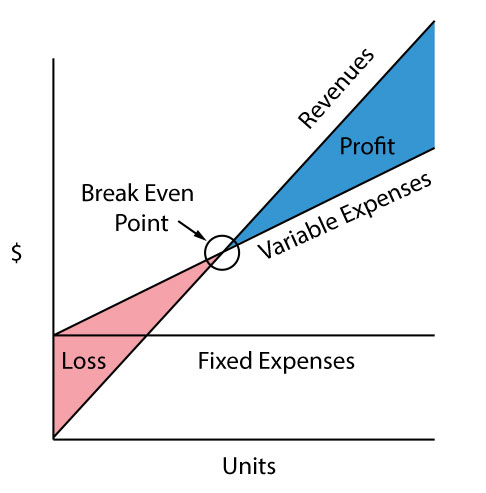
This is the minimum amount of money your business must generate in Net Sales to keep from taking a financial loss. It can be particularly useful to assess the risks associated with large capital expenditures. Break-even is one of the most basic measurements of any business. Everything before break-even is a loss, and everything after it is a profit. We naturally consider break-even as the first step toward profitability.
Your break-even point comes when your Net Sales equal your Fixed Expenses plus your Variable Expenses. (This is expressed as a dollar amount rather than a ratio.)Your break-even revenues are calculated from your Income Statement.
For example, if your Fixed Expenses total $10,000 and you have a Contribution Margin of 40 percent, then your break-even point is $10,000 ÷ 0.40 = $25,000.
This is not a number you can calculate once and use as a benchmark forever. As your business grows, you'll find that your fixed expenses grow with it. You may move into a larger facility, or you may hire additional employees. Also, your variable expenses, which directly impact your contribution margin, will change over time as well. Larger volumes may reduce your purchasing costs as a percentage of sales, or you may find more efficient ways of producing your products. Whatever your situation, it's a good idea to recalculate your break-even point on a regular basis.
Inventory Turnover
Product Costs ÷ Average Inventory
Inventory Turnover is simply a ratio letting you know the number of times your inventory is sold and replaced over a period of time. For example, if you sold $50,000 worth of products and you maintained an average inventory value of $25,000, then you turned your inventory over twice. Your product costs may be found on your Income Statement and your average inventory number may be estimated by averaging your beginning and ending inventory levels. If these do not properly represent your normal inventory, a more accurate number may be calculated by averaging all 12 month-end inventories.
If your inventory turnover rate is slow, this could indicate a problem with overstocking, a marketing problem, a problem with the ability of your suppliers to deliver or a problem with a specific product or product line. On the other hand, if your inventory turnover rate is too fast, your inventory may be too small. Not having a large enough inventory on hand could slow down your production and delivery times, negatively impacting your sales. The ideal rate varies from business to business, but in general, the more efficient you are, the faster it can be. What is an ideal inventory turnover rate for your business?
Debt to Equity Ratio
Total Liabilities ÷ Owner's Equity
This is your leverage ratio. It lets you know how far your business is in debt by comparing what you owe to what you're worth. While this is a subjective number that must be taken in context, a ratio higher than 2:1 should usually raise a flag of caution. You can calculate this ratio from your Balance Sheet.
Return on Equity
Net Profit ÷ Owner's Equity X 100
This is the rate of return you have made on your investment in your company. For example, if you have $100,000 worth of equity invested in your company and you earn a profit of $15,000 then your return on equity is 15 percent.
One way to measure success here is to compare this rate with other possible forms of investment. Your net profit may be found on your Income Statement while your owner's equity may be found on your Balance Sheet.
Return on Investment
Net Profit ÷ Average Total Assets
This is the rate of return a business has made on its assets. It is a good measure of profitability and management effectiveness. Net profit can be found on your income statement while your average total assets may be calculated from your Balance Sheets.
Return on Revenue
Net Profit ÷ Net Sales X 100
This is the Net Profit your business has made expressed as a percentage of your Net Sales (see Income Statement). It's typically expressed as a percentage on your Common Size Income Statement. The higher the percentage, the more efficient your business is as a whole.
Different business types and marketing strategies may require different strategies. If your business makes its money on volume by maintaining as low a price as possible, then you may wish to keep your return on revenues very small. Most small businesses, however, will do better with a higher return by adding value through service and quality.
Current Ratio
Current Assets ÷ Current Liabilities
This is a simple measure of the liquidity of your business. It indicates your company's ability to pay its immediate debts.
For example, if you have $200,000 worth of current assets and $100,000 worth of current liabilities, your Current Ratio is 2:1. While this is often considered a normal ratio, the ideal really does vary from business to business. In general, however, a higher Current Ratio suggests a greater margin of safety against unforeseen hardships. Your Current Ratio may be calculated from your Balance Sheet.
Any additional key Common Size percentages including:
- Variable Expenses - As a percentage of Net Sales
- Fixed Expenses - As a percentage of Net Sales
- Current Assets - As a percentage of Total Assets
- Fixed Assets - As a percentage of Total Assets
Common Size Financial Statements
Having actual dollar figures in your financial statements is important. You do need to know the actual amounts of your revenues and your expenses. You do need to know how much money your company has made so that you can plan for the future.
Another way to look at your financial statements is to "Common Size" them. Simply put, this means that instead of looking at dollar figures, you are looking at percentages. In your balance sheet, you will common size all of your amounts as a percentage of your total assets. This allows you to do a number of things:
- Easily compare performance over time.
- Easily compare performance across industry.
- Quickly identify key financial ratios such as operating profit margin and net profit margin.
- Easily identify important trends such as costs and profitability.